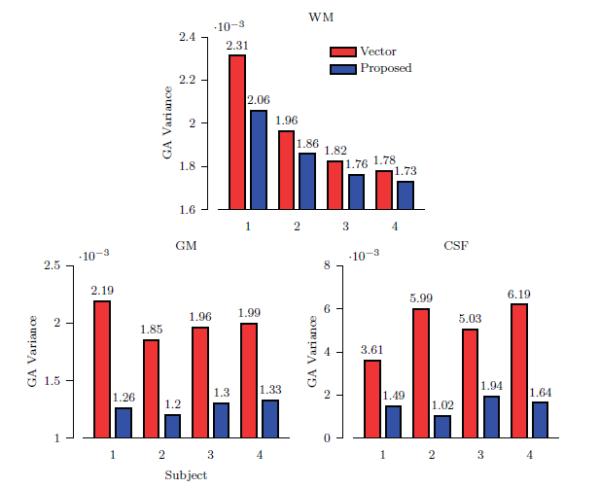
Figure 10. Average Regional Variance of Generalized Anisotropy.

The anisotropy variance at each voxel location is computed using a 3 × 3 × 3 neighborhood. The bars show the average values of the anisotropy variance. Only results for vector-based linear interpolation and the proposed method are shown since these two methods yield better structural clarity.
