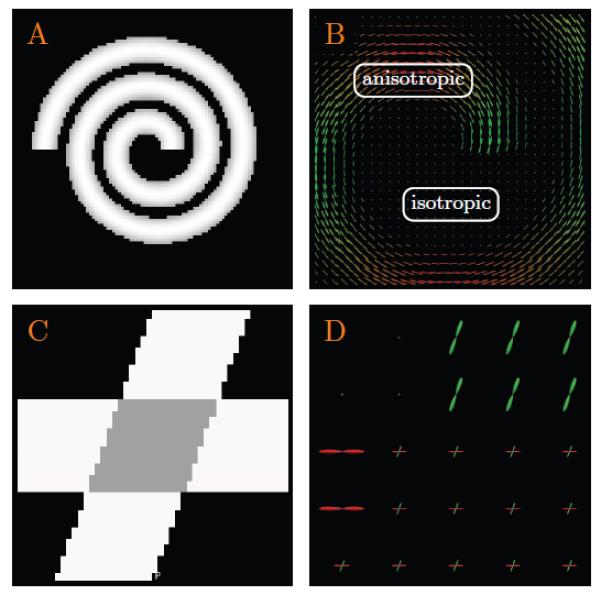
Figure 2. Synthetic Data.

(A) The spiral and (C) the cross (only the case of 60° is shown here) used for evaluation. The left panels (A) & (C) show the anisotropy maps and the right panels (B) & (D) show the close-up views of the respective ODF fields.
