
FIGURE 3.
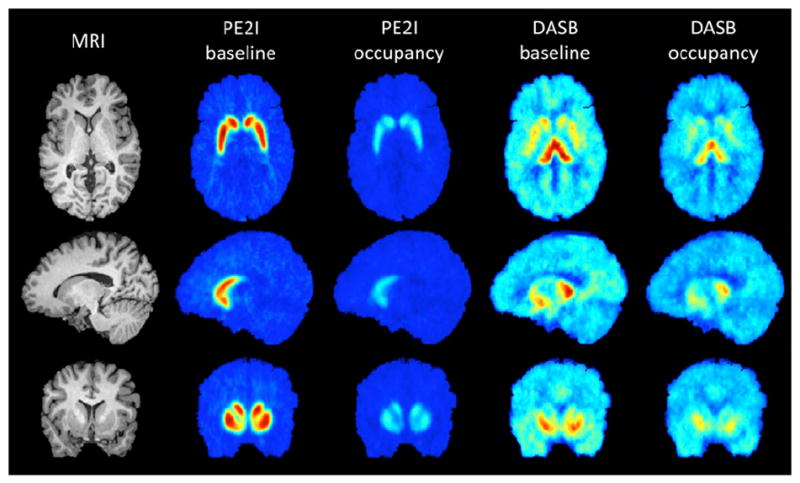
MR and mean PET images, before and after administration of SEP-225289 for the subject achieving highest serotonin transporter occupancy. Axial, sagittal, and coronal slices are shown in top, middle, and bottom rows, respectively. Left column shows MR images of subject, for anatomic reference. PET images are means of the last 6 frames of each scan (corresponding to last 60 min of scanning). Baseline scanning occurred 5–10 d before administration of SEP-225289. Difference in binding between baseline and occupancy scans is due to SEP-225289 transporter occupancy. Dopamine transporter occupancy in this subject (55%, as indicated by PE2I PET scans) was markedly higher than serotonin transporter occupancy (35%, as indicated by the DASB PET scans).