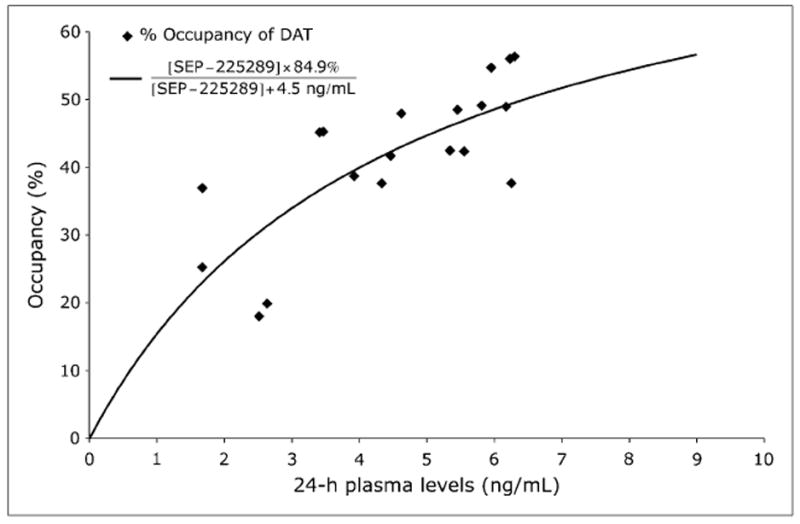
FIGURE 5.

Dopamine transporter occupancy vs. plasma level. Percentage occupancy of dopamine transporter as measured with 11C-PE2I PET images is plotted. Curve was fit to data using a nonlinear least-squares method. Parameters for best-fit curve were maximum occupancy of 84.9% and 4.5 ng/mL drug plasma concentration at 50% occupancy. These parameters are indicated in equation of fitted curve shown on top left corner. For 1 subject (S034), 27-h plasma level was used, because this subject received 11C-PE2I scan at approximately 27 h after dose administration. DAT = dopamine transporter.
