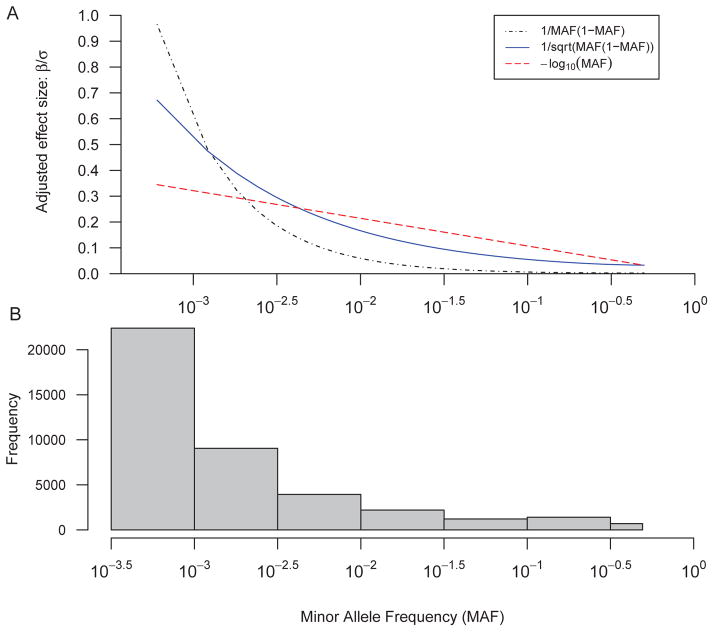
Figure 2.
Comparison of three effect size models. Panel A shows 3 settings to determine the effect size of variants as a function of the variants’ MAF. Different effect sizes are adjusted to keep total heritability constant with h2=20%, where , and genotype matrix X comes from 1000G whole-genome exome-sequencing data. As X and h2 are fixed, effect size vector β is proportional to σ along different MAF. Panel B shows the MAF distribution of the 1000G genotype data set.

