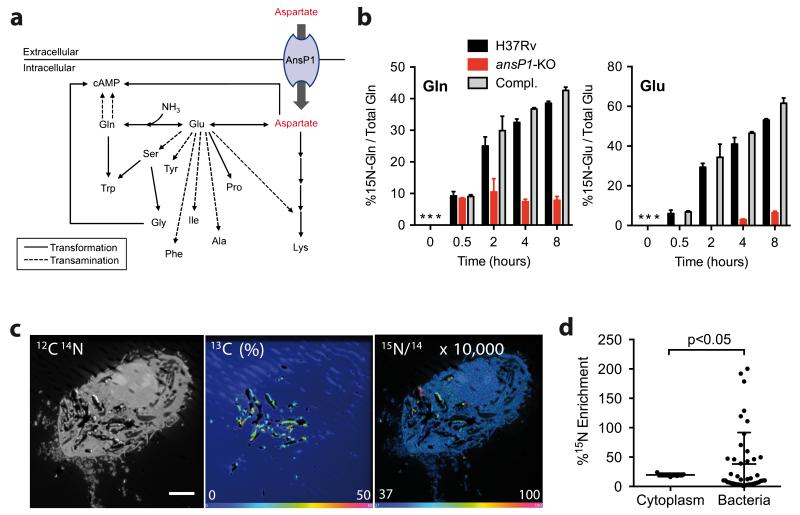
Figure 2. AnsP1 is essential for Mycobacterium tuberculosis nitrogen assimilation from aspartate.
(a) Nitrogen incorporation pathways from aspartate into various N-containing metabolites resulting from transamination (dotted line) and/or transformation (plain lines) reactions. (b) Frequency of 15N-glutamine and 15N-glutamate detected in the presence of 15N-aspartate in either M. tuberculosis wild type (H37Rv), the ansP1-KO mutant, or its complemented strain (Compl.). Data represent mean±s.d. of triplicate samples and are representative of at least two independent experiments. *, no signal detected. Any signal below 5-10% corresponds to background noise. (c) 13C-labeled bacteria were used to infect mouse macrophages. After pulsing the cells with 15N-aspartate, 13C and 15N isotope compositions were analyzed by NanoSIMS. Images display a representative infected cell. Left panel is the as recorded 12C14N− image showing the histological aspect of the cell (scale bar represents 5 μm). The central panel represents the 13C atomic fraction map (in %) of the corresponding area. The right panel shows the 15N/14N ratio image indicating the 15N-aspartate uptake. For enhanced visibility, the ratio was multiplied by 1×10⁴. The 15N/14N ratio at natural 15N abundance appears blue. (d) Quantification of 15N enrichment (compared to the resin) in surface areas chosen in the cell cytoplasm (n=5), and intracellular 13C labeled bacteria (n=43). Data represent mean ±s.d. and were analyzed using the Student’s t test. The 15N-enriched phagosomes, arbitrarily defined as those vacuoles with a 15N enrichment above mean+3s.d. of that observed in the host cell cytoplasm, represent 34.9% of all phagosomes.

