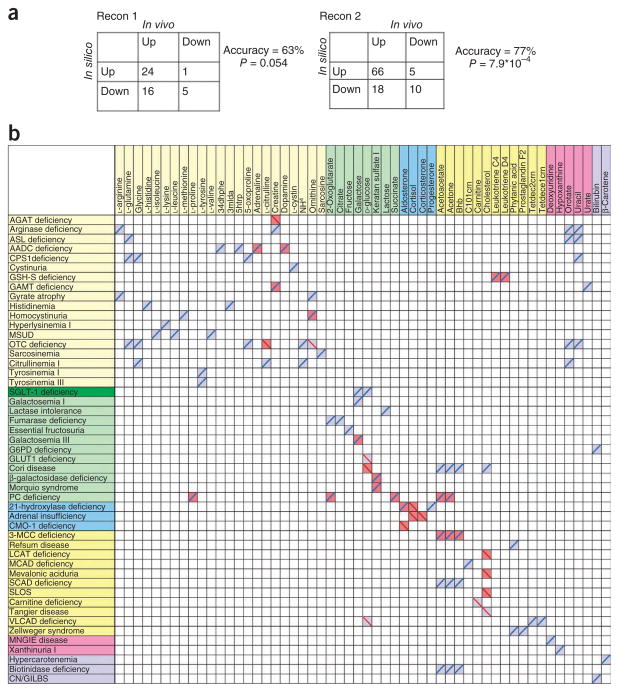
Figure 3.
Predicted biomarkers for IEMs. (a) Comparison of the prediction accuracy of Recon 1 and Recon 2 against the gold standard8. (b) Correct and incorrect predictions. IEMs and biomarkers are sorted by subsystem. Bright yellow, amino-acid metabolism; green, central metabolism; blue, hormones; yellow, lipid metabolism; pink, nucleotide metabolism; lilac, vitamin and cofactor metabolism. Blue and red shading corresponds to predicted increase and decrease in biomarker, respectively. Blue and red lines represent reported increase and decrease of the biomarker in plasma, respectively. 34dhphe, 3,4-dihydroxy-L-phenylalanine; 3mlda, 3-methylimidazoleacetic acid; 5htrp, 5-hydroxy-L-tryptophan; bhb, (R)-3-hydroxybutanoate; tetdec2crn, tetradecadienoyl carnitine; tetdece1crn, tetradecenoyl carnitine. (See Supplementary Table 5 for complete names of the IEMs.)

