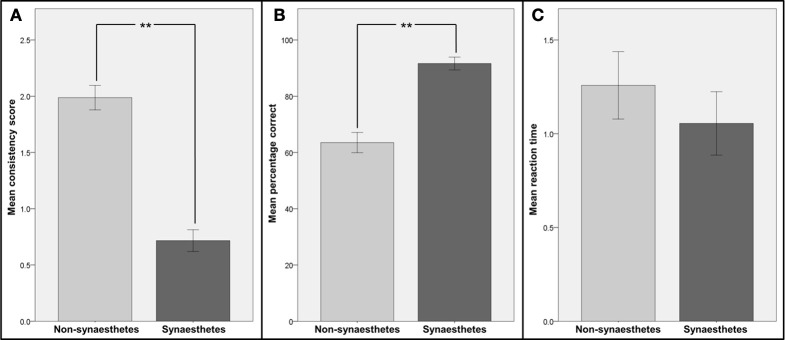
Figure 2.

Comparison of consistency and reaction times for patients identified as synaesthetes with those for patients identified as non-synaesthetes. Participants were divided into two groups: those identified as synaesthetes (N = 5, dark gray bars) and those identified as non-synaesthetes (N = 16, light gray bars). (A) Mean consistency scores (GC-synaesthetes: mean =; SD =, non-synaesthetes: mean = 1.99; SD =), (B) mean percentage of correct responses in the speeded consistency test and (C) mean reaction times in the speeded consistency test are shown. Note that for the two synaesthetes who reported synesthesia for numbers only, the scores and reaction times for numbers only were used. Error bars represent between-subject standard errors, stars indicate level of significance.
