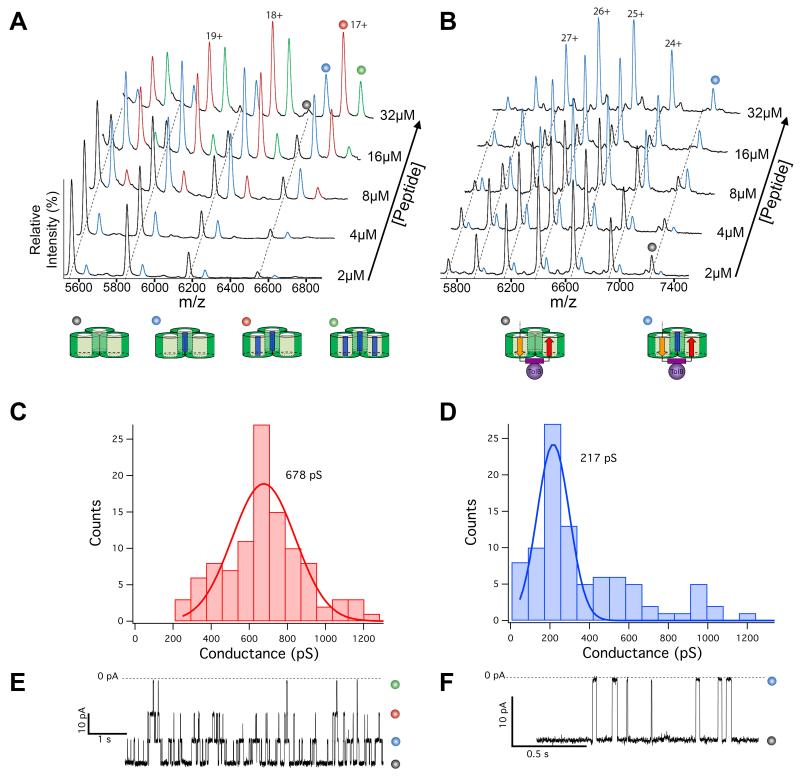
Figure 3. ColE9 occupies two subunits of an OmpF trimer.
(A) ESI-MS titration showing binding of up to three OBS1 peptides to OmpF in the gas phase (see Table S2 for masses). Peak assignments are shown below the data (OBS1 represented as a blue rectangle). (B) ESI-MS titration showing the binding of one OBS1 peptide to the proteolysed translocon. Peak assignments are shown below the data (see Fig. S6 for colour coding of ColE9 IUTD binding epitopes). (C) Histogram showing a Gaussian distribution of unitary conductance (pS) measurements for OmpF trimers in planar lipid bilayers. (D) Histogram showing the Gaussian distribution of unitary conductance (pS) measurements for the digested ColE9 translocon, where the mean value is one third the OmpF conductance observed in C. (E) Electrical recording (−50 mV) for a single OmpF trimer showing the blockade of its three channels by the OBS1 peptide, states assigned as in A. (F) Electrical recording (−50 mV) for the trypsin digested translocon showing the blockade of its single OmpF channel by the OBS1 peptide, states assigned as in B.

