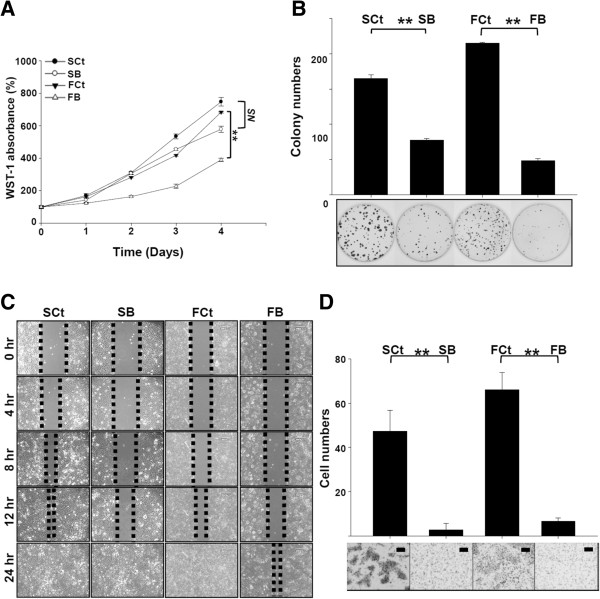
Figure 2.
Impact of AEG-1 knockdown on the function of HNSCC cell lines. (A) WST-1 cell proliferation assay. (B) colony formation assay. (C) wound-healing migration assay. Initial gap: 500 μm. (D) transwell Matrigel invasion assay. All values are the average of three independent experiments. SB, AEG-1 knock-down SAS cells. FB, AEG-1 knock-down FaDu cells. SCt, SAS cells transfected with scrambled control shRNA. FCt, FaDu cells transfected with scrambled control shRNA. All data were expressed as mean ± SEM; n = 3. NS, not significant (p > 0.05); **, p < 0.01. Scale Bar: 130 μm.

