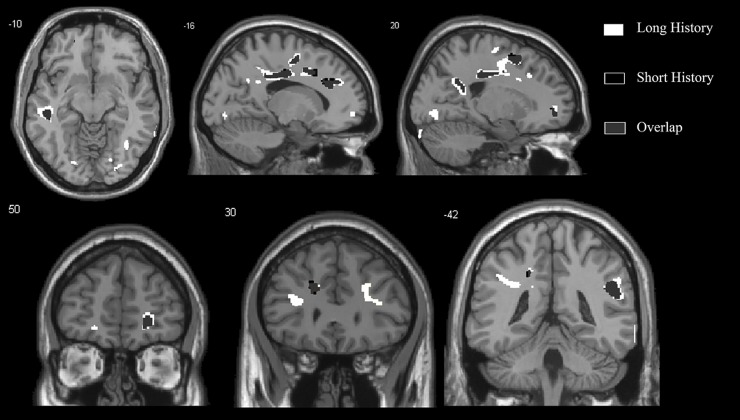
Figure 4.
This image demonstrates the overlap (grey) between the atrophy in grey mater in 9 patients with anosmia for less than 1 year (black) compared with 10 patients with anosmia for more than 1 year (white). The level of significance of the voxel-based morphometry results is p<0.001 and images overlay onto the average T1 image of all subjects. The top row shows two sagittal slices and one axial slice, whereas the bottom row shows three coronal slices.

