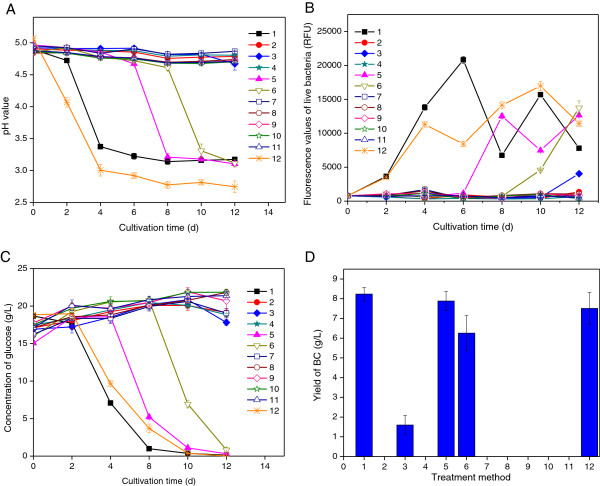
Figure 2.
Effects of different detoxification methods on cultures of G. Xylinus. The figure shows the time course of the pH value (A), the fluorescence values of live bacteria (B), the residual glucose (C), and the yield of BC after 12 days of cultivation (D). Treatment methods 1–10 represent culture media based on hydrolysate detoxified with 10 different methods and correspond to the detoxification methods numbered in Table 1; method 11 represents untreated hydrolysate, and method 12 represents a reference medium without inhibitors. Mean values and standard deviations from three separate experiments are given.

