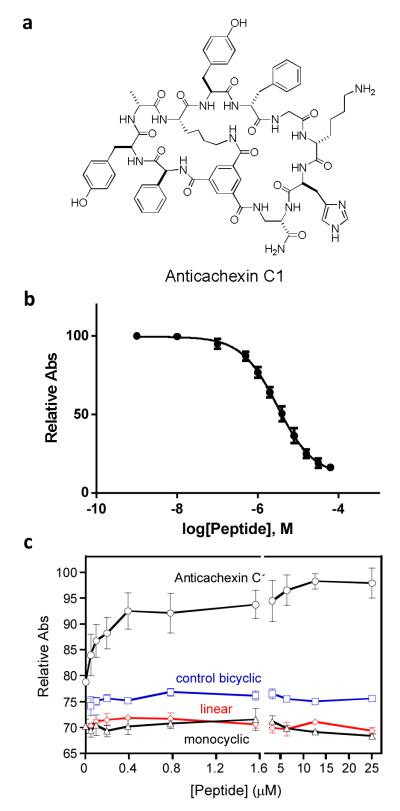
Figure 4.
(a) Structure of Anticachexin C1. (b) Inhibition of TNFα-TNFR1 interaction by Anticachexin C1. The absorbance values on the y axis, which reflect the amount of TNFR1 bound to immobilized TNFα in the presence of increasing concentrations of Anticachexin C1, are relative to that in the absence of peptide inhibitor (100%). (c) Protection of WEHI-13VAR cells against TNFα (0.04 ng/mL)-induced cell death by Anticachexin C1 (0-25 μM). The absorbance values on the y axis, which reflect the number of live cells, are relative to that of DMSO control (no TNFα, no peptide).

