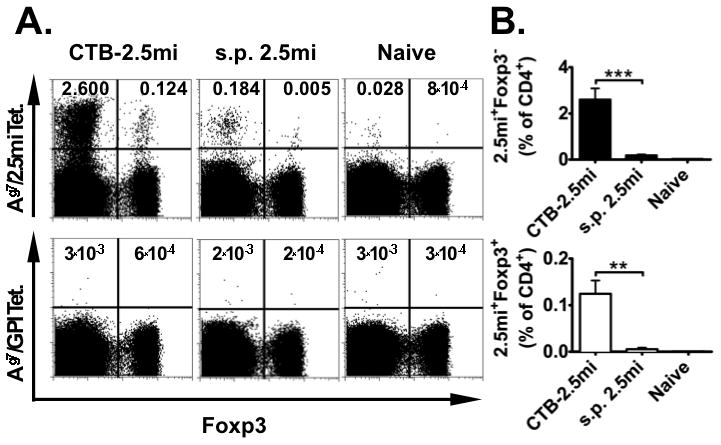
FIGURE 2. In vivo expansion of 2.5mi+ T Cells by CTB-2.5mi.

NODxB6.Foxp3EGFP F1 females (n=3) were immunized i.p. with 6.5 nmol of synthetic peptide 2.5m or CTB-2.5mi. Four days later, expansion of antigen-specific CD4 T cells was analyzed by staining with Ag7/2.5mi or Ag7/GPI282–292 control tetramers and analyzed by FACS.
(A) Representative FACS profiles showing the percentage of splenic 2.5mi+ effector T cells and 2.5mi+Foxp3+ Treg. T cells were gated on B220−, CD8−, PI− and CD4+.
(B) Bar diagram of the same experiment showing the mean ± SEM of the percentage 2.5mi+ effector T cells (top) and 2.5mi+Foxp3+ Treg (bottom; **p<0.01, ***p<0.0001). The diagram was generated from 2 independent experiments, using 3 mice per experiment and type of treatment.
