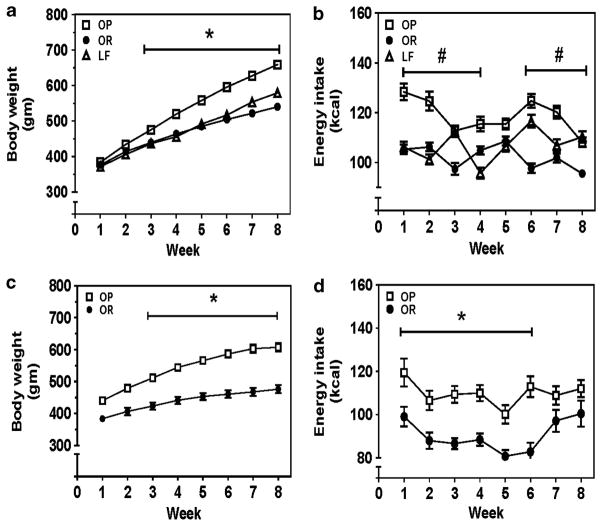
Figure 1.
Development of DIO. Outcome studies: (a) The OP group exhibited greater body weight compared with OR and LF groups; *P<0.001, OP vs OR and LF. (b) The OP group exhibited greater mean daily energy intake compared with the OR group; #P<0.001, OP vs OR. Food intake was determined daily, and the amount of food intake was multiplied by caloric density of the respective diet to obtain the daily energy intake. The daily energy intake was averaged across the 7 days of the week. Thus, each symbol in panels b and d represents the mean daily energy intake across the 7 days of the respective week. (a, b) Data were pooled from groups employed in studies 1–8 and expressed as mean±s.e.m. (s.e.m. smaller than symbol size); n = 48–52 rats per group. The number of rats employed for different assays was VMAT2 function, n = 6 per group; DAT uptake, n = 12–14 per group (two separate series of DAT uptake assays); METH-induced DAT reverse transport, n = 6–8 per group; DAT cellular localization, n = 8 per group; striatal DAT function and extracellular dopamine concentration, n = 8 per group; motivation for food reinforcement, n = 8 per group. Predictor study: (c) The OP group exhibited greater body weight and (d) greater energy intake compared with the OR group. Data are expressed as mean±s.e.m.; n = 6 rats per group; *P<0.05, OP vs OR.

