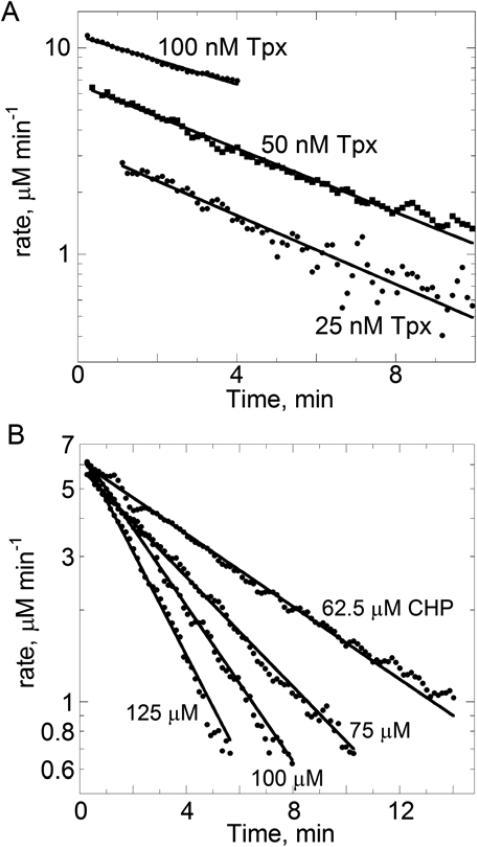
Figure 3.
Changing rates of NADPH oxidation over time at various Tpx (A) or CHP (B) concentrations. First, slopes to give “instantaneous” rates were obtained by linear fitting, over a narrow window of five points at a time, of the data shown in Figure 2; the window was advanced by one point and the process repeated across the time series. Rates were calculated from the 340 nm data using the molar extinction coefficient for NADPH as described in the text. Rates were then replotted on a logarithmic scale versus time and fit to an exponential decay model. Fits did not include data beyond 90% inactivation due to the noise in the data at these levels.

