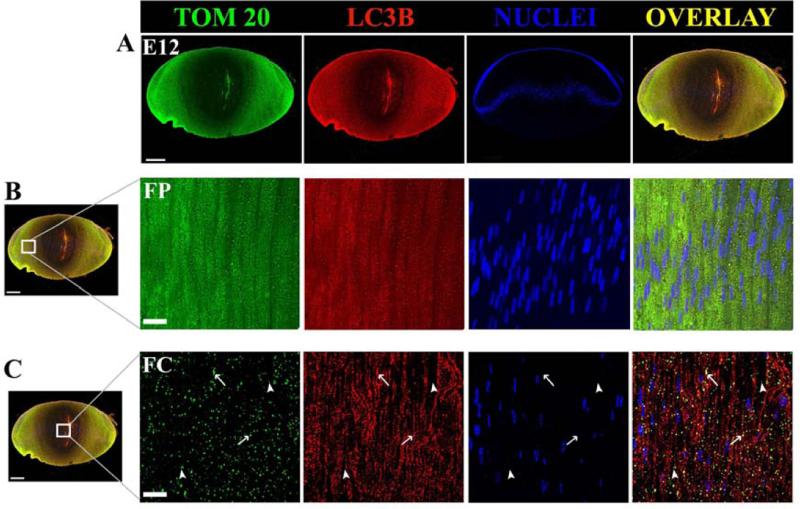
Figure 4. Co-Localization of the autophagy marker LC3B and the mitochondrial marker TOM20 in the E12 embryonic chick lens.
Co-localization of TOM20 (green) and LC3B (red) puncta and overlay of the two images (orange/yellow) in E12 chick lenses using confocal fluorescent microscopy. (A) A 20 μm midsagittal section from an E12 whole embryonic chicken lens stained for TOM20 (green), LC3B (red) and nuclear stain TO-PRO-3 (blue). (B) FP (cortical fiber) region of the chick lens and (C). FC (central fiber core) region of the chick lens. (D) EQ (equatorial region) of the chick lens. Fig. 4D is valuable for demonstrating (a) multiple layers of nuclei in the epithelium consistent with the TEM in Fig. 3, (b) the great amount of autophagic vesicles (LC3B dots) and mitochondria (TOM20 dots) in the equatorial region, (c) correspondence of the dots in the overlay suggesting many of the mitochondria are undergoing autophagy, and (d) there is more autophagy here than in the core (Fig. 4C) suggesting a radial decrease in autophagy from the epithelium to the core consistent with the gradient found in the TEM images (Fig. 3). Arrows indicate TOM20 green and LC3B red puncta and their co-localization (orange/yellow color in overlayed images) in each sub-compartment of the lens examined.


