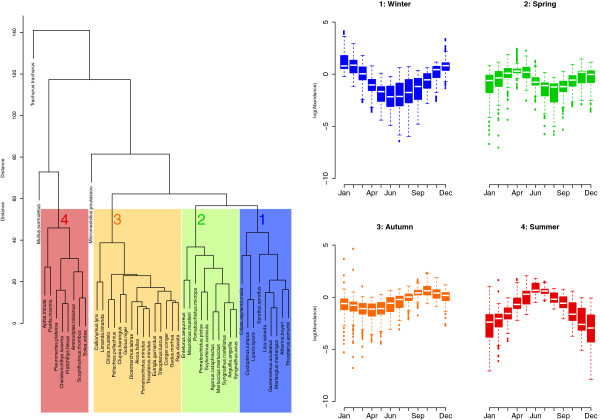
Figure 1.
Seasonal groupings in the fish assemblage at Hinkley Point. Dendrogram: four seasonal groups of species identified by cluster analysis based on the seasonal fluctuation term in the model. This fluctuation term is driven by the water temperature and month effects, as identified in the fitted generalized additive models (GAMs). Box plots: the pattern of the ln-scaled relative abundances for each seasonal cluster: winter (group 1), spring (group 2), autumn (group 3) and summer (group 4).

