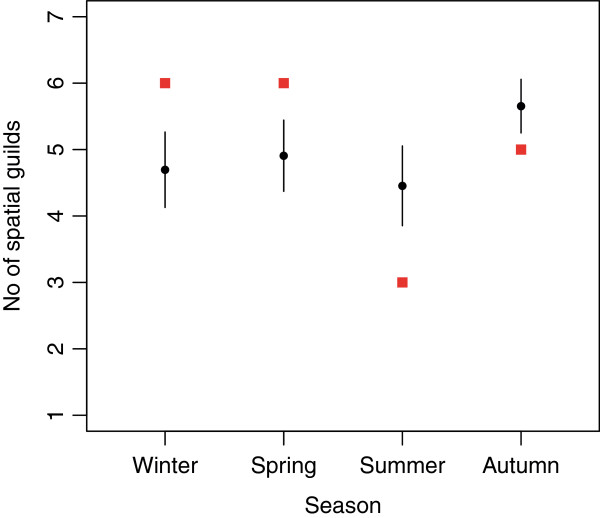
Figure 3.
Representation of spatial guilds in each of the seasonal groups. The expected (black circles with 95% confidence intervals) and observed number (red squares) of different types of spatial guild in each seasonal group. The expected number of spatial guilds occupied in a given season was derived using a randomization test (see methods for details).

