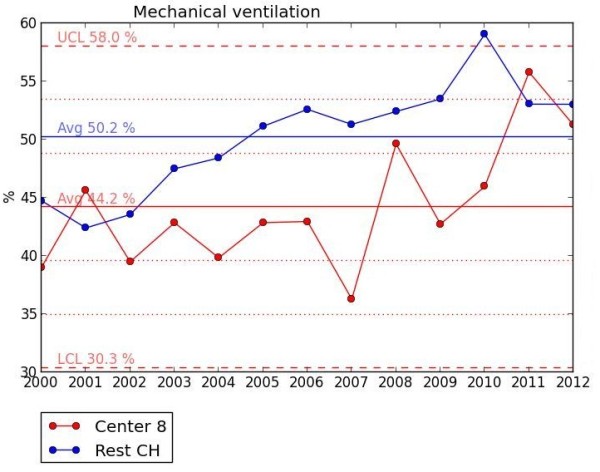
Figure 1.

Benchmarking diagram. Plsek’s p-chart for mechanical ventilation for unit 8 versus the other level III NICUs in Switzerland (CH) displaying historical annual percentages for 2000–2012. The mean (Avg) percentage over the entire period is 44.2% for the unit and 50.2% for CH. The 1st and 2nd standard deviation (SD) of the unit are dotted lines (SD were calculated using the formula SD = SQRT {[mean percentage x (1 - mean percentage)] / [sample size]}) whereas the 3rd SD are dashed lines. The unit’s upper and lower control limits (UCL = 58% and LCL = 30.3%, respectively) are set by convention at ± 3 SD beyond the mean.
