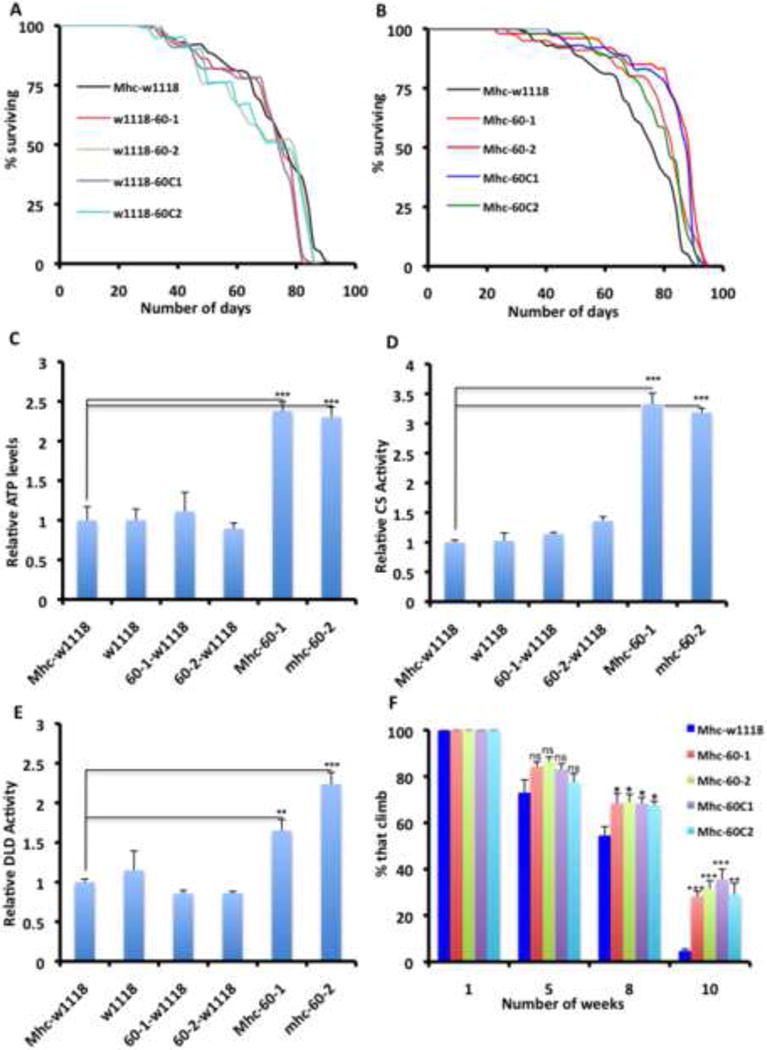
Figure 4. Forced Expression of UPRmt Genes is Sufficient to Preserve Muscle and Mitochondrial Function.

(A) Lifespan curves of flies expressing Hsp60 and Hsp60C outcrossed to w1118 flies, compared to Mhc-Gal4 flies outcrossed to w1118 flies.
(B) Lifespan curves of flies expressing Hsp60 or Hsp60C crossed to Mhc-Gal4, compared to Mhc-Gal4 flies crossed to w1118 flies. All transgenes result in an increase in lifespan relative to the background control. Note that the Mhc-w1118 curves are the same in A and B, as the lifespan assays in A and B were performed concurrently.
(C-E) Relative ATP levels, CS activity levels and DLD activity levels respectively, of thoraxes from flies with the genotypes listed, after 5 weeks at 25C. Figure labeling is as follows: (i) Mhc-Gal4 crossed to w1118 labeled as Mhc-w1118 (negative control), (ii) w1118 (i.e as wildtype flies), (iii) UAS-hsp60 insertion #1 crossed to w1118 labeled as 60-1-w1118 (control for insertion site #1), (iv) UAS-hsp60 insertion #2 crossed to w1118 labeled as 60-2-w1118 (v) Mhc-Gal4 crossed to UAS-hsp60 insertion #1 or #2, labeled as Mhc-60-1 and Mhc-60-2 respectively. n=4, error bars denote s.e.m; and * = p<0.05, ** = p<0.01 and *** = p<0.001.
(F) Climbing ability of flies expressing Hsp60 or Hsp60C under the control of the Mhc-Gal4 driver. Data shown is for three independent experiments, and is expressed as the mean ± s.e.m. The starting number of flies for each genotype in each experiment = 100, and * = p<0.05, ** = p<0.01 and *** = p<0.001. p values shown refer to comparisons between the particular genotype and Mhc-Gal4/w1118 flies (deep blue columns). Climbing ability was not preserved when the Hsp60/60C transgenic flies were crossed to w1118 flies (not shown).
See Figure S4C and Table S6R.
