
Figure 6. ImpL2 Secretion from Muscles with Mitochondrial Distress Triggers Non-Autonomous Repression of Insulin Signaling.
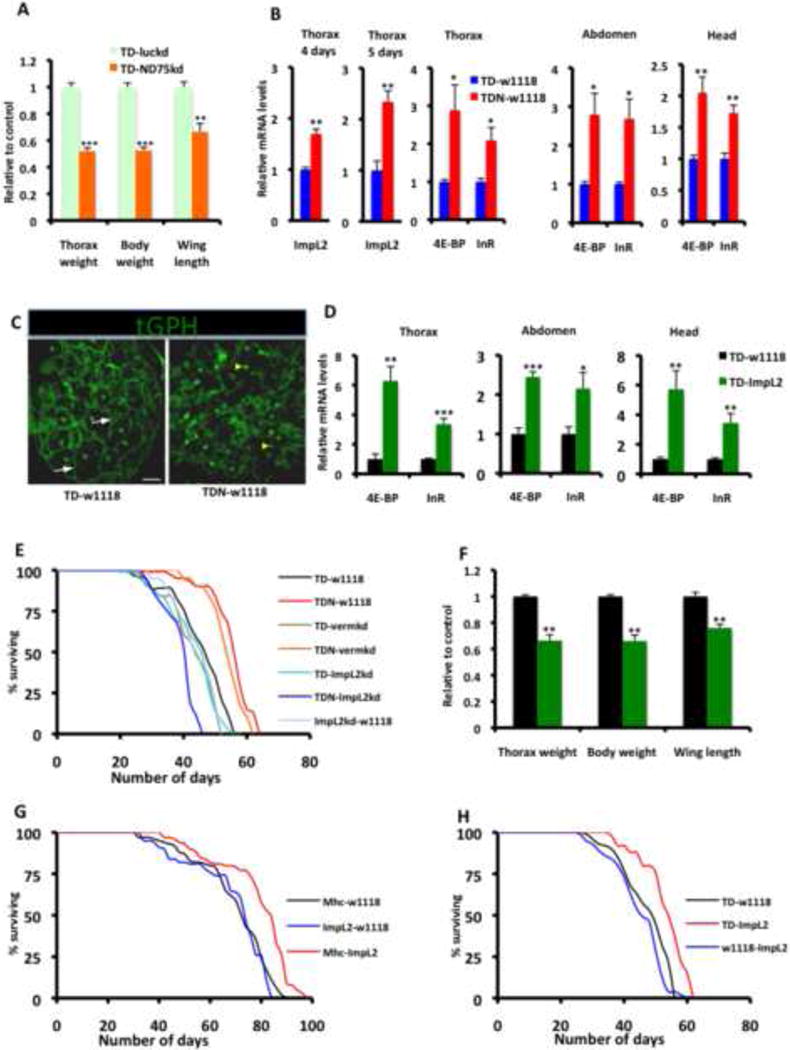
(A) Relative thorax weight, overall body weight and wing length of flies expressing RNAi to ND75 (TD-ND75kd) relative to control flies expressing RNAi to luciferase (TD-luckd). Larvae were collected at 29C for 120 hours and then returned to 18C until adults eclosed. In each instance, n = 4 cohorts, with each cohort consisting of 20 flies.
(B) ImpL2 is induced in TDN flight muscles relative to TD flight muscles at 4 (first panel, from left) and 5 (second panel) days after shifting adult flies to 27C. This correlates with the induction of 4E-BP and InR in flight muscles (thorax) of TDN flies (third panel). In addition, these markers are induced non-autonomously in the abdomen (fourth panel) and head (fifth panel) of TDN muscles
(C) Localization of tGPH (a PI3K activity reporter) in fat body from TD (left) and TDN (right) flies. Note the extensive membrane recruitment of tGPH (white arrows) in fat body from TD flies. However, in fat bodies from TDN flies, expression of the reporter was largely restricted to the nucleus (yellow arrowhead) and surrounding cytoplasm. Scale bar is 20μm
(D) Overexpression of ImpL2 in the thorax results in the induction of targets of insulin repression in the thorax (left panel) as well as in the abdomen (middle panel) and head (far right panel).
(E) Lifespan curves of flies expressing TDN or TD with various transgenes. The increased lifespan of TDN flies outcrossed to w1118 flies (red, TDN-w1118) or vermillionRNAi (orange, TDN-vermkd, which serves as a negative control for RNAi expression) is suppressed when TDN is crossed to ImpL2RNAi (blue, TDN-ImpL2kd).
(F) Thorax weight, total body weight and wing length of flies expressing ImpL2 (TD-ImpL2) relative to control flies (i.e TD-w1118). In each instance, n = 4 cohorts, with each cohort consisting of 20 flies. Note the considerably smaller thoraxes, total body weight, and shorter wing length of TD-ImpL2 flies relative to TD-w1118 controls.
(G) Lifespan curves of flies expressing UAS-ImpL2 outcrossed to w1118 flies compared to Mhc-Gal4 flies outcrossed to w1118 or UAS-ImpL2 flies. Lifespan was performed at 25C.
(H) Lifespan curves (performed at 27C) of flies expressing UAS-ImpL2 outcrossed to w1118 flies, compared to TD flies crossed to w1118 or UAS-ImpL2 flies.
In all panels, fold change shown refers to the mean ± s.e.m and * = p<0.05, ** = p<0.01 and *** = p<0.001. n=4 independent experiments. Also see Figure S6 and Table S7