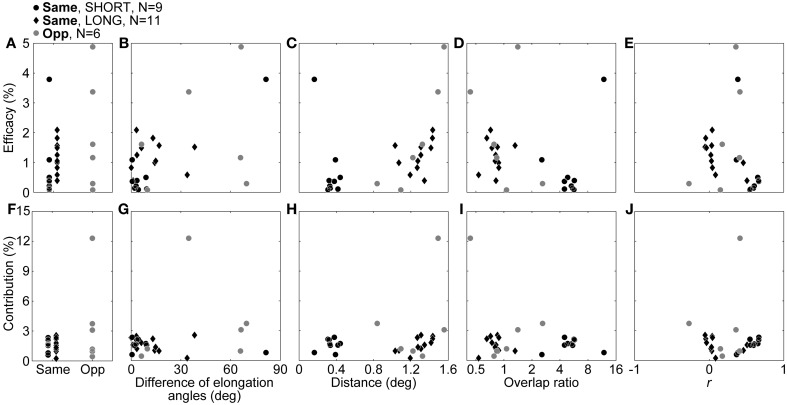
Figure 6.
Efficacy and contribution, and the correlations with RF properties. In the upper row, the efficacy itself (A), correlations with the difference of the elongation angles (B), distance between RF center positions (C), overlap ratio (D), and correlation coefficient of the RF structures (E), are shown. In the lower row, the contribution itself (F), correlations with differences of elongation angles (G), distance between RF center positions (H), overlap ratio (I), and correlation coefficient of the RF structures (J) are shown. Black dots, black diamonds, and gray dots indicate SHORT, LONG, and opposite-response-sign connections, respectively.

