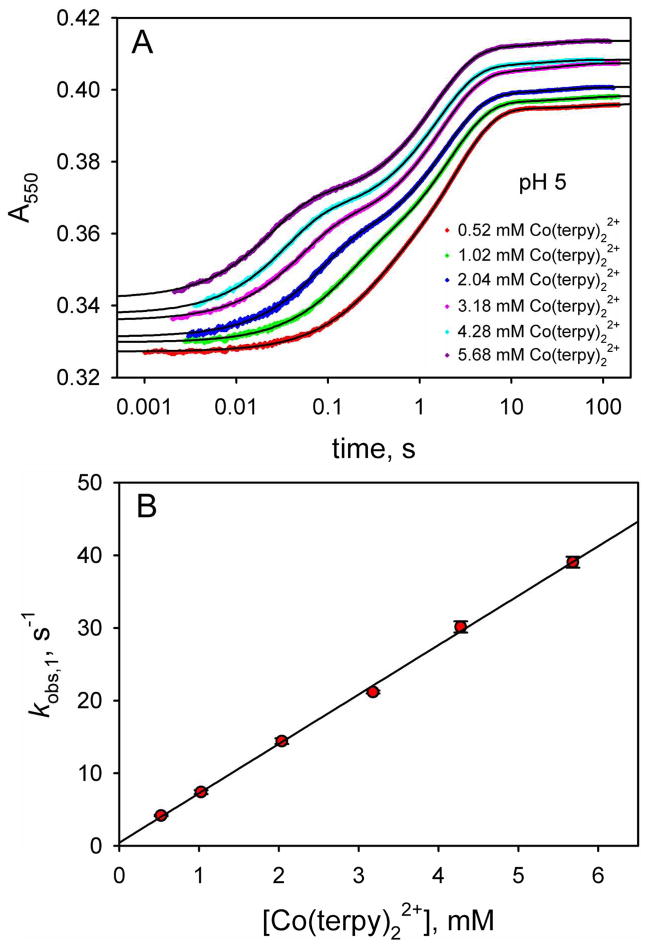
Figure 5.
(A) ET from Co(terpy)22+ to oxidized WT*K79H at pH 5 as a function of time monitored by absorbance at 550 nm, A550. The time axis is logarithmic. Data are shown at 6 different Co(terpy)22+ concentrations. The absolute magnitudes of A550 have been adjusted so that the data at different Co(terpy)22+ concentrations can be compared readily. For data collected with a 10 mm pathlength, the following adjustments were made: 0.52 mM, no adjustment to A550; 1.02 mM, observed A550 – 0.27; 2.04 mM, observed A550 – 0.8. For data collected with a 2 mm pathlength, the following adjustments were made: 3.18 mM, observed A550 – 0.06; 4.28 mM, observed A550 – 0.19; 5.68 mM, observed A550 – 0.30. The solid black curves are fits of each data set to a triple exponential rise to maximum equation. (B) Dependence of kobs,1 on Co(terpy)22+ concentration obtained from fits to the data in panel A. The slope of this line yields kET = 6.8 ± 0.1. Similar plots at pH values from 5.5 to 8 are given in Figure S1 of the Supporting Information. The kET values from fits to a linear equation are collected in Table 1.

