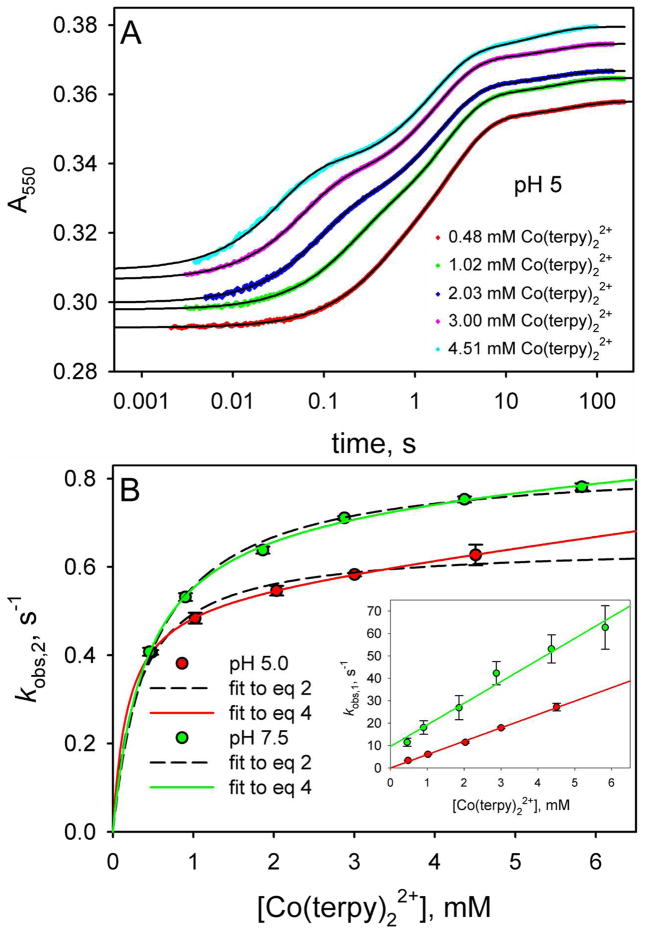
Figure 7.
Reduction of yK79H iso-1-Cytc as a function of Co(terpy)22+ concentration. (A) Reduction of oxidized yK79H iso-1-Cytc by Co(terpy)22+ monitored as a function of time at 550 nm, A550. The time axis is logarithmic. Data are shown at 5 concentrations of Co(terpy)22+. The absolute magnitudes of A550 have been adjusted so that the data at different Co(terpy)22+ concentrations can be compared readily. For data collected with a 10 mm pathlength, the following adjustments were made: 0.48 mM, no adjustment to A550; 1.02 mM, observed A550 – 0.265; 2.03 mM, observed A550 – 0.79. For data collected with a 2 mm pathlength, the following adjustments were made: 3.00 mM, observed A550 – 0.06; 4.51 mM, observed A550 – 0.21. The solid black curves are fits of each data set to a triple exponential rise to maximum equation. (B) Rate constants for the fast phase, kobs,1, and intermediate phase, kobs,2, for reduction of oxidized yK79H by Co(terpy)22+ as a function of Co(terpy)22+ concentration. The main panel shows kobs,2 as a function of Co(terpy)22+ concentration at pH 5.0 and 7.5, with fits to eq 2 (dashed curves) and eq 4 (solid curves). The inset shows the dependence of kobs,1 on Co(terpy)22+ concentration. The slopes of the lines in the inset yield kET. The values of kET obtained were used in the fits of the kobs,2 versus Co(terpy)22+ concentration data in the main panel to eq 2 and eq 4. The rate constants kET, kET(alk), kb and kf in the square-scheme kinetic model (Figure 3), derived from these fits, are collected in Table 1.

