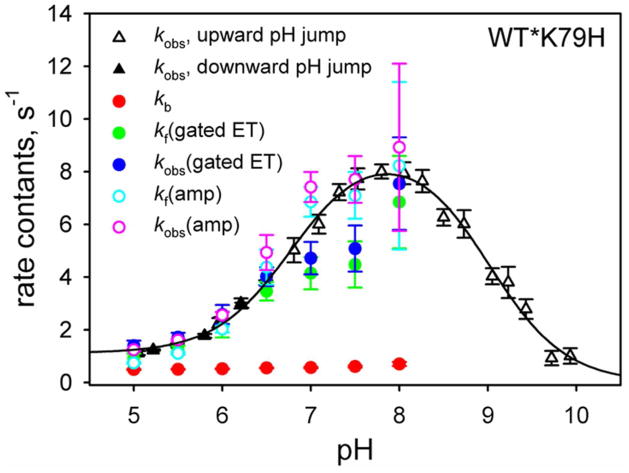
Figure 8.
Comparison of rate constants for the His79-heme alkaline conformational transition of WT*K79H iso-1-Cytc obtained from gated ET experiments to kobs for the same conformational transition obtained with pH jump stopped-flow measurements. kb obtained from gated ET data is shown with filled red symbols. kf is either obtained from fits to the data in Figure 6 [filled green symbols, denoted kf(gated ET)] or as kf = KC(H79)app×kb [open cyan symbols, denoted kf(amp)] using the amplitude data in Figure 4B to obtain KC(H79)app. kobs(gated ET) (filled blue symbols) is the sum of kb and kf(gated ET) and kobs(amp) (open pink symbols) is the sum of kb and kf(amp). Error bars for kf(amp) are from standard propagation of the errors in kb and KC(H79)app (Table S12 in the Supporting Information). Error bars for kobs(gated ET), and kobs(amp) are obtained from standard propagation of the errors in kb and kf(gated ET) or kf(amp). kobs data from pH jump experiments (solid and open black triangles for downward and upward pH jumps, respectively) are from reference 44. The solid black curve is a fit of the pH dependence of the kobs data from pH jump experiments to the mechanism in Figure 2, albeit without the pKH1 ionization.44,45

