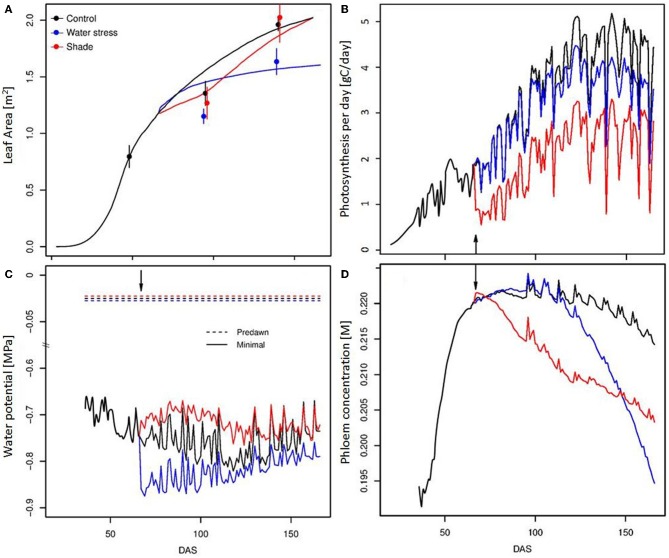
Figure 3.
Temporal evolution (DAS, Days After Sowing) of the leaf surface (A), of the daily plant photosynthesis (B), predawn and minimal mean stem water potentials (C) and mean daily phloem concentration (D) for the 3 modalities (control, water deficit, and shade treatment). The lines correspond to simulation output, and the points to experimental observations. The arrow indicates treatment start.

