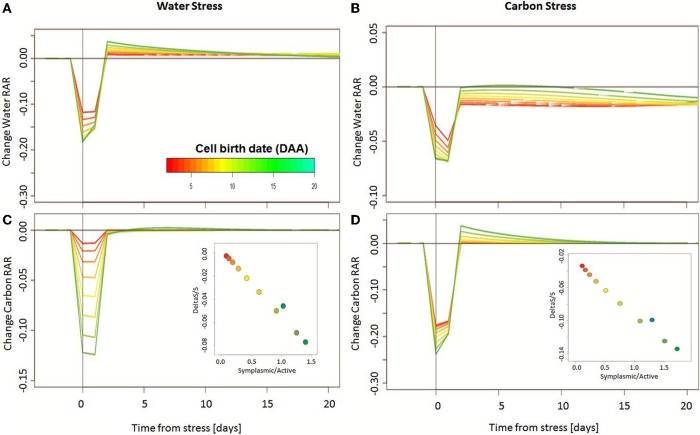
Figure 8.
Change in simulated cell water and carbon relative accumulation rate (RAR) after the application of a 24-h water deficit (A,C) or carbon limitation (B,D). Stress is applied at 20 DAA. The colors refer to cell age, red being the oldest and green the youngest, at the time of stress. Inset: following the application of stress, relative dry mass loss is directly linked to the symplasmic over active transport ratio of the cell, at the time of stress. Young cells with a high symplasmic transport appear more sensitive to stress than old ones, with a reduction in dry mass over 5% for water deficit, and over 10% for carbon limitation.

