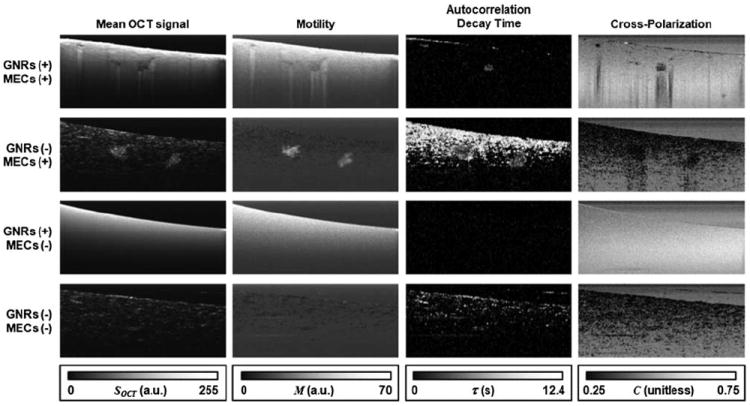
Fig. 2.

Image stacks of 4 collagen:Matrigel tissue cultures containing both MECs and GNRs (top row), MECs only (second row), GNRs only (third row) and control (bottom row). Each column displays a different way of processing the image stacks, as described in the text. Images represent 1.4 mm × 0.6 mm in x and z.
