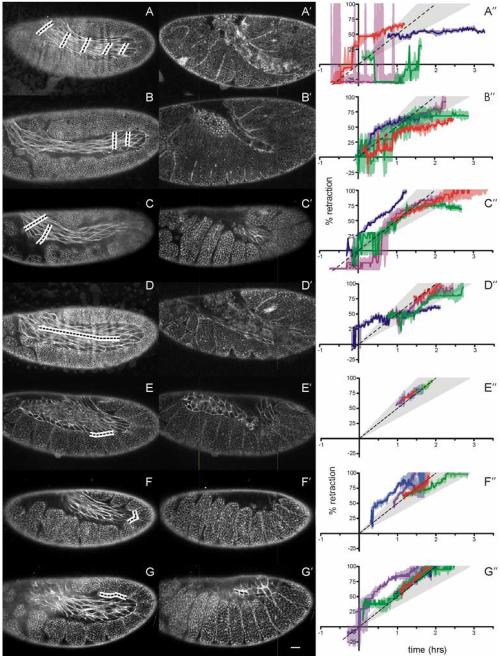
Figure 4.
Laser ablation of the amnioserosa during germ band retraction. (A-G) Confocal images of fly embryos before ablation of the marked regions (blacked dashed lines surrounded by white). (A′-G′) Same embryos after ablation. Images were taken at the time when germ band retraction would have completed in an unablated embryo. The common scale bar in G′ represents 20 μm. (A″-G″) Staging graphs corresponding to the ablation designs of A-G. Each colored curve represents retraction progress of a single experiment (shaded regions denote staging confidence intervals). The standard retraction rate (dashed line) ± two standard deviations (light gray shading) is shown for comparison. Curves similar in slope to the dashed line are retracting normally. Horizontal curves have stopped retracting.

