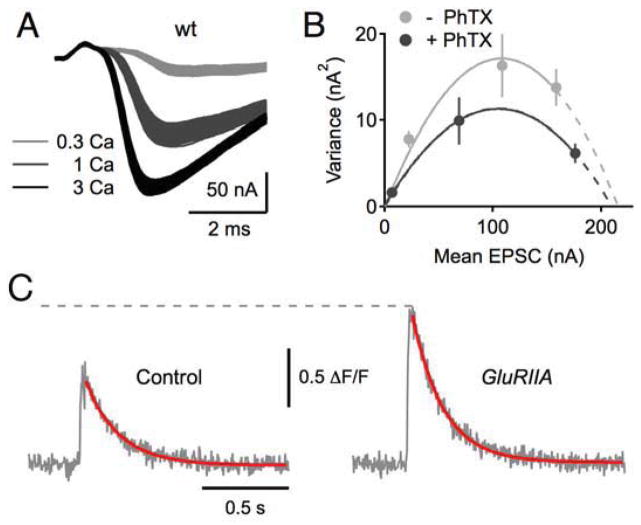
Figure 4. Presynaptic homeostasis is achieved by parallel changes in the size of the readily releasable vesicle pool and presynaptic calcium influx.
A–B) Variance-mean analysis supports a RIM-dependent modulation of the RRP during synaptic homeostasis. Left, example EPSC traces for a WT NMJ at the indicated extracellular calcium concentration (millimolar). B) Example EPSC amplitude variance-mean plots of two WT synapses in the absence (gray) and presence (black) of PhTX with parabola fits (solid lines) that were extrapolated to the x-intercept (dashed lines; see Muller et al., 2012). C) Representative traces for measurement of the spatially averaged calcium signal within synaptic boutons at the NMJ in a wild type (control) and GluRIIA mutant. The homeostatic enhancement of presynaptic release is correlated with a statistically significant increase in the peak amplitude of the spatially averaged calcium signal (see Muller and Davis, 2011).

