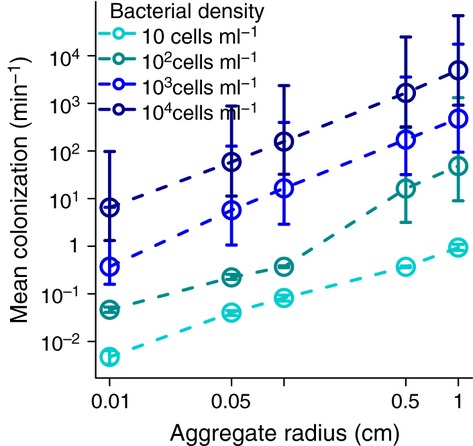
Figure 3.

Mean time to colonization, the rate at which aggregates with no target species cells were colonized. Rates are the average of all colonization events over 10,000 simulated minutes; at high rates, this often corresponds to a single event. Axes are log10-transformed, and colors represent the constant background density of the target species in the water surrounding an aggregate. Means and 95% confidence intervals are for the rates from all simulations for each parameter combination.
