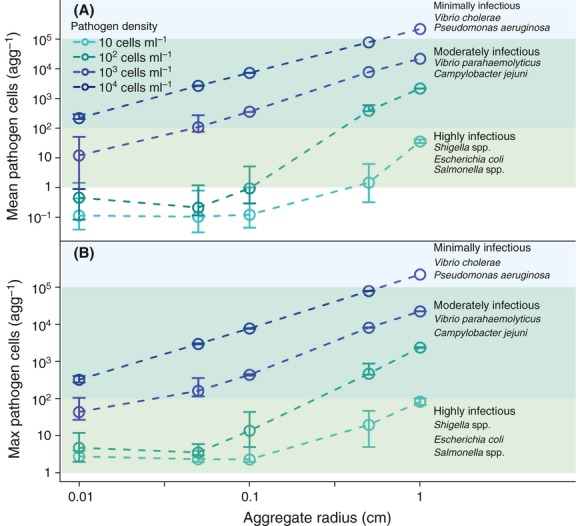
Figure 6.

Population size of target species on aggregate. To illustrate how the theoretically obtained abundances relate to concentrations of pathogens relevant to human health (i.e., infectious doses), the population sizes are plotted with shaded regions representing aquatic bacterial pathogens with a corresponding minimum infectious dose. (A) Mean population size over the entire simulation. (B) Maximum population size over the simulation, usually corresponds to the end of the simulation. Axes are log10-transformed, and colors represent the constant background density of the target species in the water surrounding an aggregate. Means and 95% confidence intervals are for the population sizes from all simulations for each parameter combination. Minimum infective dose for a selection of waterborne bacterial pathogens (Rusin et al. 1997; Lampel et al. 2012).
