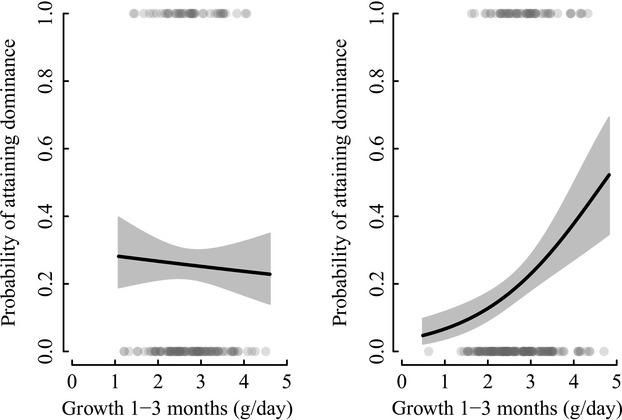
Figure 2.

Relationship between growth until independence (g/day) and probability of dominance acquisition in (A) males and (B) females. Shown are the raw data (grey points) and the fitted effect (solid line) and standard error (grey shading) of growth until independence on dominance acquisition from a GLMM including this effect only. The effect of growth was significant in the model for females but not males.
