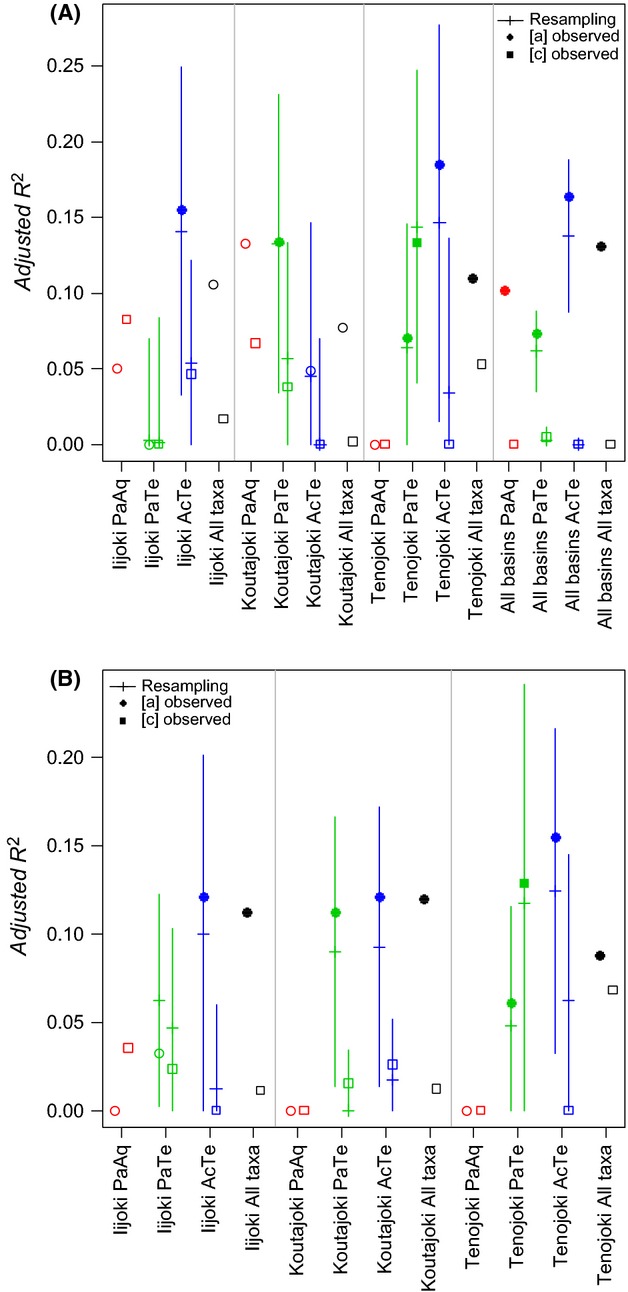
Figure 3.

Pure environmental [a] and spatial [c] fractions in variation partitioning when using overland distances (A) and watercourse distances (B). Different colors denote each dispersal mode group to facilitate comparisons between basins and within the dispersal mode groups. Filled symbols indicate significant fractions. Whiskers show mean and standard deviations when the information content of PaTe and AcTe matrices was reduced to the same level as in the most species poor group (PaAq). Negative fractions are converted to 0.
