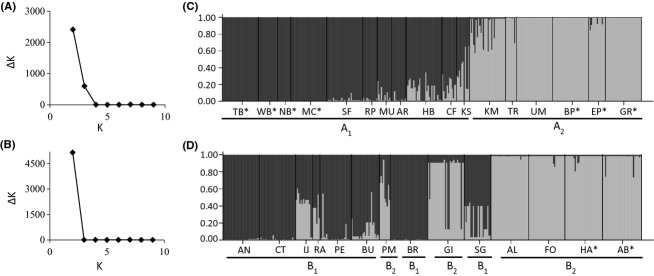
Figure 4.

Structure analyses. Evanno et al.'s (2005) ΔK values for each putative number of populations (K) for (A) Arctotheca populifolia and (B) Petrorhagia nanteuilii. Structure Q plots generated using the maximum value of ΔK indicate A. populifolia (C) and P. nanteuilii (D) samples represent two genetic groups each, demarcated by labeled bars (i.e., A1). Samples from the introduced range are denoted by asterisks. Each individual is represented by a vertical line showing degree of admixture. Sample name abbreviations are defined in Figure 1.
