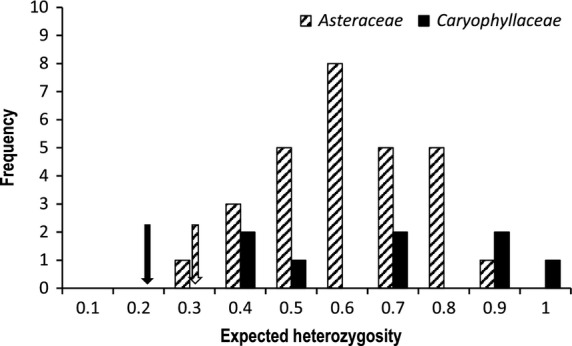
Figure 6.

Native range estimates of expected heterozygosity from microsatellite data in Asteraceae (striped) and Caryophyllaceae (solid) families (see Table S1, for details). Arrows indicate the level of heterozygosity found in the native ranges of the species used in the present study (calculated from all sites sampled in the native range of each species).
