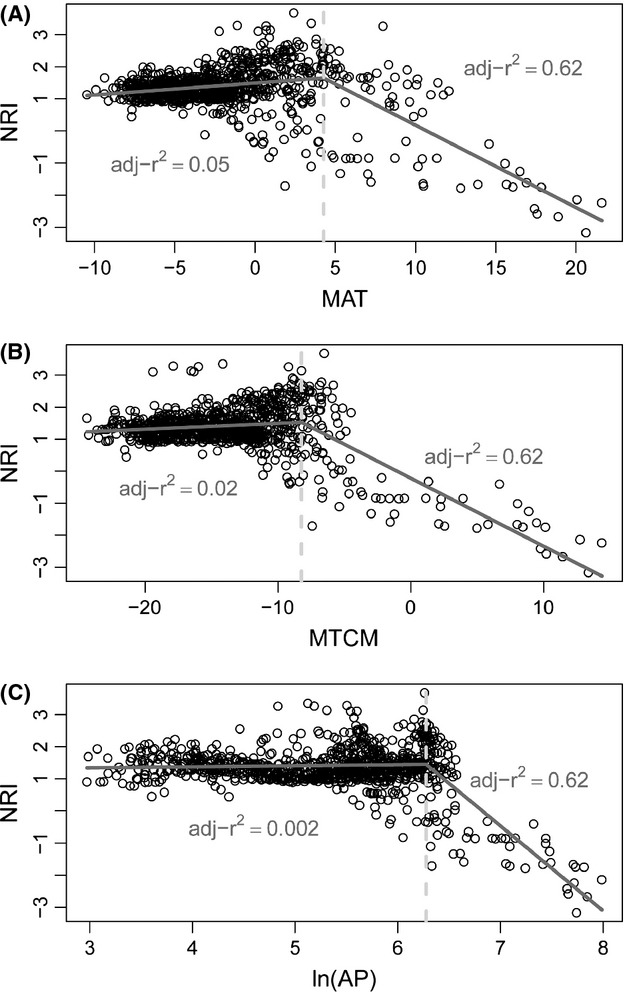
Figure 4.

Changes in phylogenetic structure (NRI) along the gradients of (A) mean annual temperature (MAT, °C), (B) mean temperature of the coldest month (MTCM, °C), and (C) logarithm-transferred annual precipitation (AP, mm). The R2 of the piecewise regression was 0.35, 0.47, and 0.44, and breakpoint was 4.27°C, −8.24°C, and 6.28 for the MAT, MTCM, and logarithm-transferred AP (equivalent to AP = 532.7 mm), respectively.
