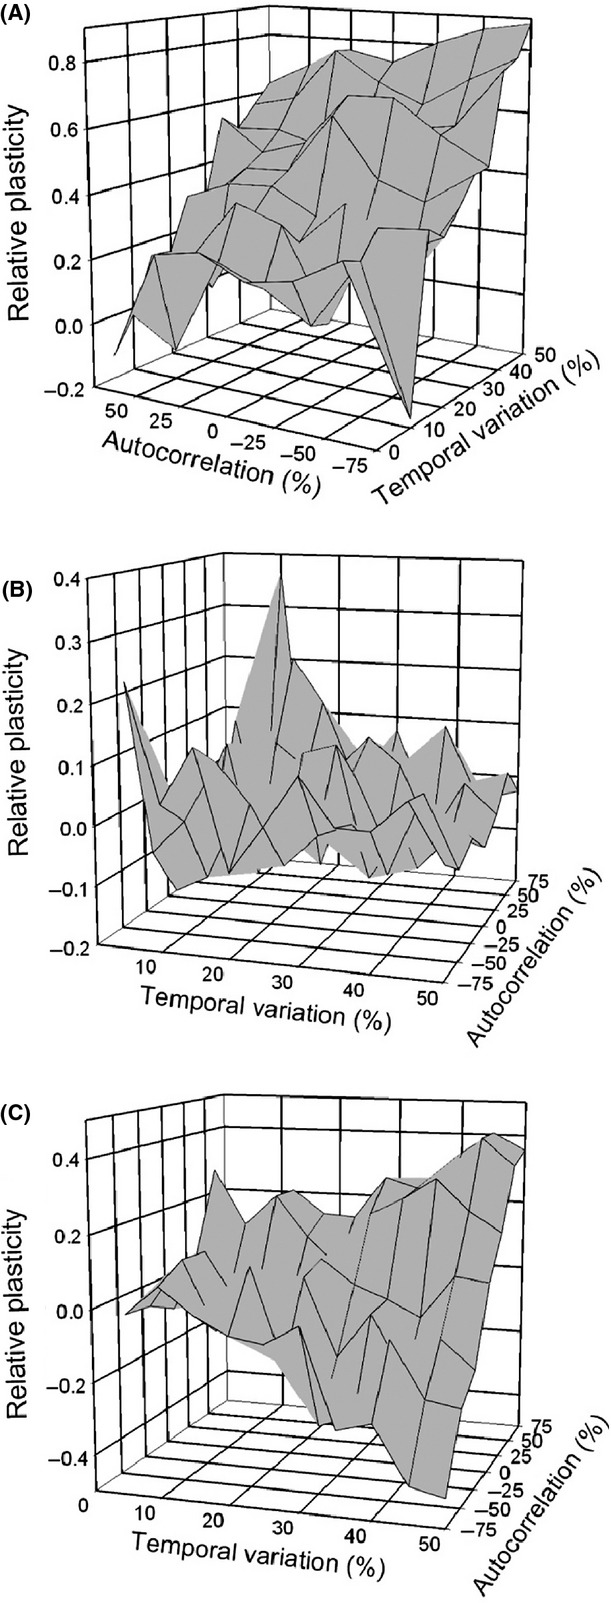
Figure 1.

The propensity for plasticity to be favored by temporal variation. A relative plasticity value of 1.0 indicates a pure plasticity outcome. Temporal variation is scaled as a percentage of the standard deviation of that variation. (A) Change once per generation prior to development. (B) Change both before and after development with no correlation for the within-generation change. (C) Change both before and after development with varying magnitudes of positive or negative autocorrelation for the within-generation change. Note the differences in scale of the vertical axes.
