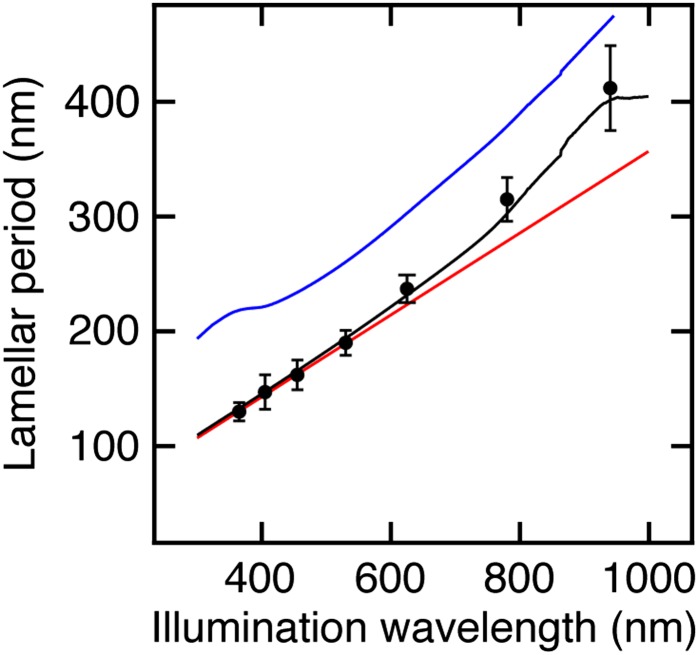
Fig. 4.
Comparison of the experimentally observed wavelength dependence of the lamellar period with simulated periods produced by different scattering models. The black circles are the experimentally observed values of the period for lamellae grown under different illumination wavelengths. Each circle represents the average of 25 measurements and the error bars represent 2 SDs in the average value. The red trace is the simulated interference period due to dipole scattering at the surface of a flat Se–Te film. The blue trace is the simulated period due to Bloch mode scattering from a periodically structured Se–Te surface. The black trace is the simulated period combining both scattering modes where the contributions from the surface and Bloch modes are weighted based on the penetration depth of the incident light.

