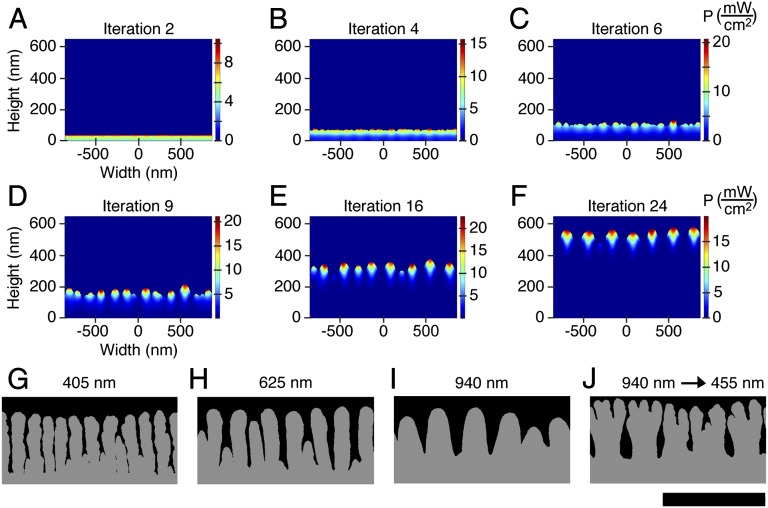
Fig. 5.
Iterative growth model to simulate feedback between the local absorption profile and phototropic growth of the Se–Te films. (A–F) Simulated absorption profiles at different iterations of growth for Se–Te lamellar patterns under 625-nm normal-incident, plane-wave illumination with the electric field vector of the illumination perpendicular to the plane of the page. The images in A–F have been stretched vertically for clarity and have an aspect ratio of 1.8. (G–J) Simulated structures formed under different illumination wavelengths using the iterative growth model. Films grown under linearly polarized, plane-wave illumination at wavelengths of (G) 405 nm, (H) 625 nm, (I) 940 nm, and (J) in which the illumination wavelength was switched from 940 to 455 nm during the growth simulation. [Scale bar: 1 µm (applies to the images in G–J, which have an aspect ratio of 1).]

