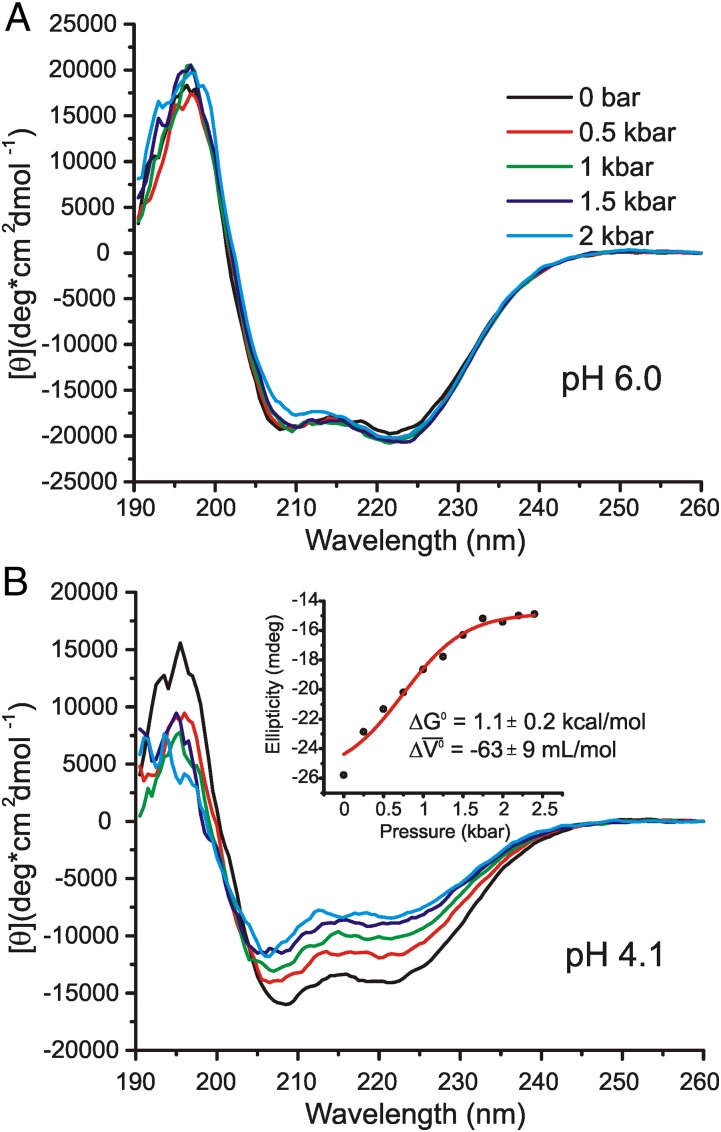
Fig. 2.
Variable-pressure CD spectra of apoMb. Each spectrum is the average of nine scans. (A) Far-UV CD spectra of 24 μM apoMb in 5 mM MES at pH 6.0, without salts, from 0 to 2 kbar in 0.5-kbar increments. (B) Far-UV CD spectra of 24 μM apoMb in 5 mM MES at pH 4.1, without salts. (Inset) Plot of ellipticity vs. pressure and the best fit (red trace) to a two-state model of the transition to give the indicated ΔG0 and Δ (Methods).

