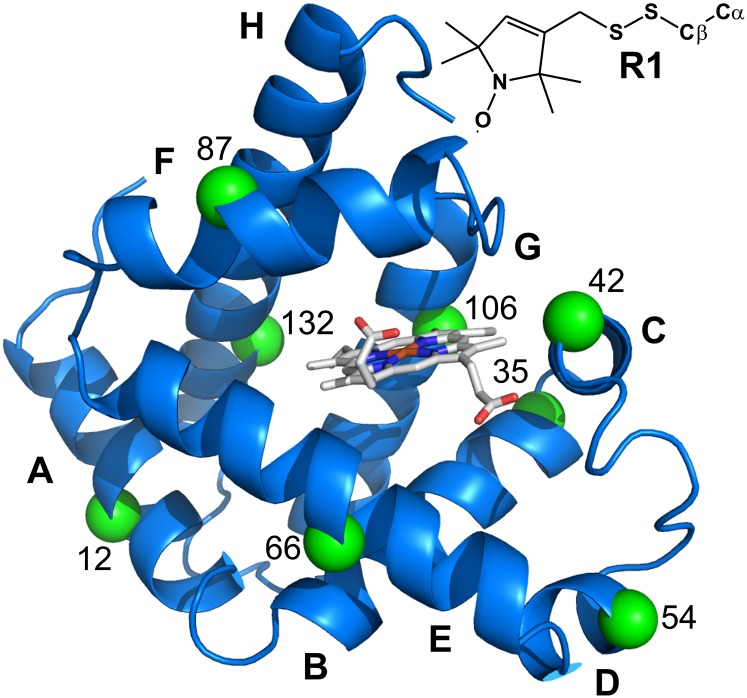
Fig. 3.
Ribbon model of the holoMb structure (Protein Data Bank ID code 2MBW) (79). The green spheres at the Cα positions identify the residues where the R1 side chain was introduced, one at a time, for EPR experiments. The heme group is shown in stick representation. (Inset) Structure of R1.

