Fig. 4.
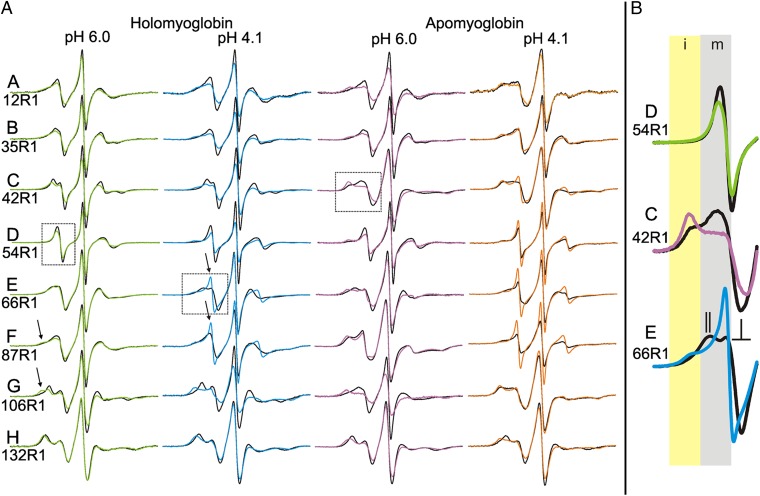
EPR spectra of R1 in the various states of myoglobin as a function of pressure. (A) EPR spectra at 0 bar (black trace) and 2 kbar (colored trace) are shown for R1 at the indicated sites and states of myoglobin. The arrows highlight examples of spectral components corresponding to immobilization of the nitroxide in the holoMb pH 6.0 state, and to rapid isotropic motion of the nitroxide in the holo pH 4.1 state. (B) The different classes of pressure-dependent spectral change are illustrated using enlargements of the low-field regions of the spectra identified by the dotted boxes. Shaded areas indicate the portions of the spectra that display intensity corresponding to mobile (m, gray) and immobile (i, yellow) motional states of the nitroxide. In response to an increase in pressure, the spectrum of residue 54R1 (Top) exhibits only subtle changes in the single spectral component; the spectrum of 42R1 (Middle) exhibits a shift in the population toward the component corresponding to an immobilized state, whereas that for 66R1 (Bottom) exhibits a shift toward a spectral component representing rapid isotropic motion of the nitroxide. The 0-bar spectrum of 66R1 (black trace) illustrates the characteristic lineshape for a nitroxide undergoing rapid anisotropic motion, where parallel and perpendicular hyperfine components are resolved (25), as indicated. This feature may be recognized in several of the spectra for holoMb in column 1 in A. The component corresponding to the more mobile state of 54R1 and 42R1 (black traces) also reflects anisotropic motion, but the order is too weak to resolve the parallel and perpendicular components.

