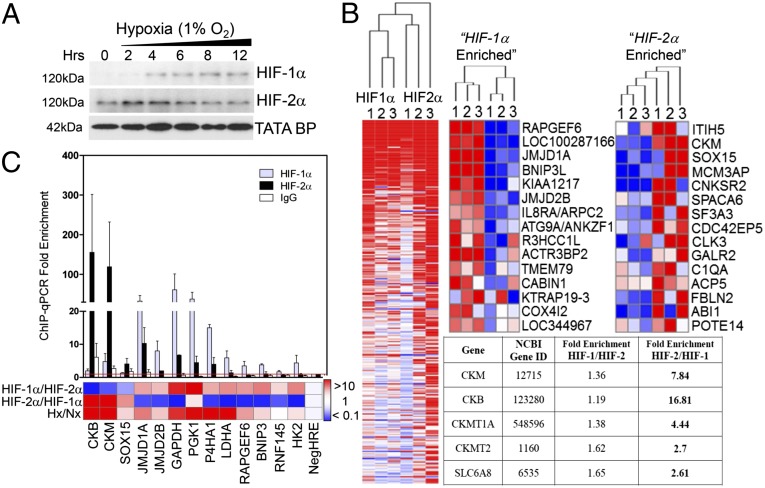
Fig. 1.
HIF-1 and HIF-2 ChIP-on-chip. (A) Accumulation of nuclear HIF-1α and HIF-2α in Caco-2 IECs in normoxia (0 h) and hypoxia. (B) Heat maps generated from normalized smoothed ratios of ChIP enrichment (GENE-E), showing common targets (Left) and discrete promoter occupancy (Right). (Inset) Functional annotation clustering of ChIP–chip hits revealed genes involved in Cr metabolism as HIF-2–specific targets (C) ChIP–chip results were validated by qPCR analysis following ChIP using anti–HIF-1α, anti–HIF-2α, or IgG. Bar graph represents fold enrichment of ChIP DNA compared with input chromatin (n = 3).

