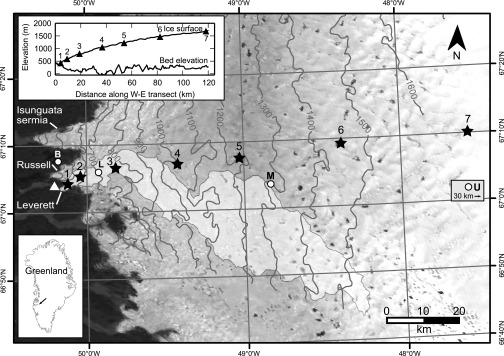
Fig. 1.

Location of the transect on the western margin of the GrIS. Stars indicate sites where ice motion, temperature, and seasonal melting were measured. The triangle indicates where proglacial discharge was measured and the GPS base station located. Circles indicate locations of ‘KAN’ PROMICE/GAP weather stations along the K transect. Contours (in meters) are from a digital elevation model (DEM) of the ice sheet surface produced from interferometric synthetic aperture radar (InSAR) (29). The inferred hydrological catchment of Leverett Glacier, delineated in light gray, was calculated from the ice sheet surface DEM. Inset shows surface and bed elevation along our transect as measured by IceBridge ATM (ILATM2) and MCoRDS (IRMCR2) in 2010 and 2011, respectively (30).
