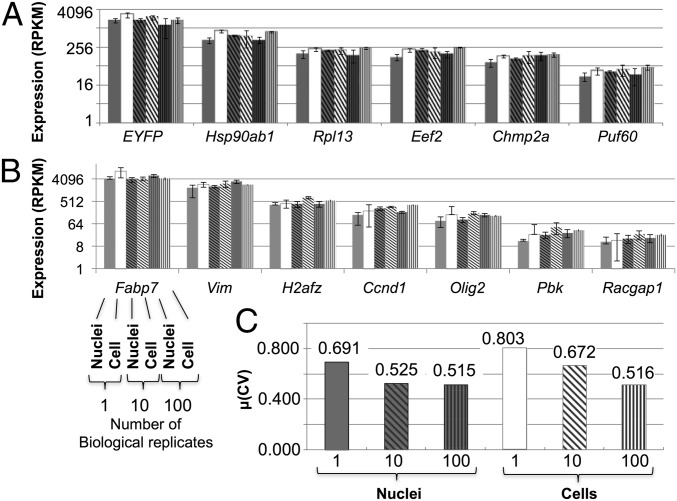
Fig. 4.
Transcript levels and variation are the same in nuclei and whole cells after sequencing. Expression (RPKM) values for housekeeping genes (A) and NPC-specific genes (B) were used to compare sequenced cells and nuclei. For each gene (x axis), sets of six bars represent the six samples of various numbers of pooled biological triplicates and are in the following order: 1 nucleus, 1 cell, 10 nuclei, 10 cells, 100 nuclei, and 100 cells (indicated for the Fabp7 gene only in B). Error bars denote 1 SD. The y axis is log2 scaled. (C) Measure of dispersion for each group of samples for single and bulk (10 and 100) nuclei and cells. Dispersion (statistical variability) is calculated as the mean of the CV of each gene across biological triplicates.

