Fig. 3.
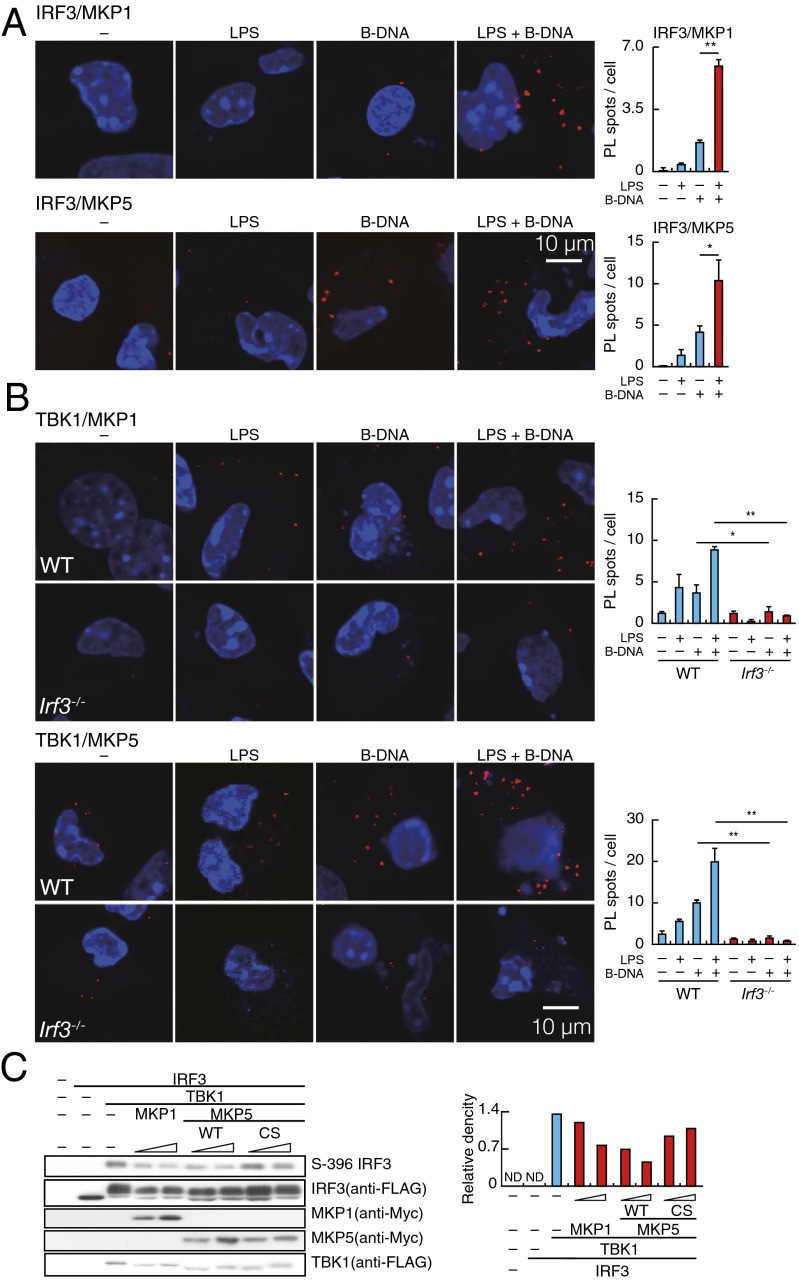
TLR-induced suppression of IRF3 by MKP proteins. (A, Left) PLA for IRF3–MKP1 or IRF3–MKP5 complex in peritoneal macrophages stimulated for 4 h with LPS, B-DNA, or B-DNA plus LPS. Red spots indicate IRF3–MKP, whereas nuclei are stained in blue (DAPI staining). In A, Right, data for quantitative analysis for the PL spots in a cell are shown. **P < 0.01; *P < 0.05. (B, Left) PLA for TBK1–MKP1 or TBK1–MKP5 complex in WT and IRF3-deficient (Irf3−/−) peritoneal macrophages stimulated with LPS, B-DNA, or B-DNA plus LPS. Red spots indicate the TBK1–MKP complex, whereas nuclei are stained in blue (DAPI staining). In B, Right, data for quantitative analysis for the PL spots in a cell are shown. **P < 0.01; *P < 0.05. (C, Left) Immunoblot analysis of IRF3, TBK1, and MKPs in HEK293T cells that overexpress FLAG-tagged IRF3, FLAG-tagged TBK1, and myelocytomatosis oncogene (Myc)-tagged MKPs, respectively, as assessed by SDS/PAGE. Relative band intensity (phospho-IRF3/IRF3) is shown in C, Right.

