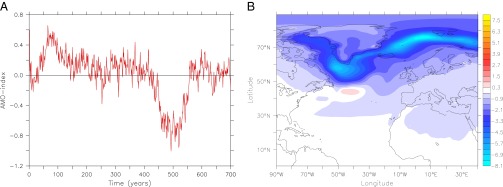
Fig. 1.

The temperature signal associated with the cold event. (A) Time series of the AMO index, taken as the SST anomaly in the North Atlantic averaged over 0°–70°N in degrees Celsius, relative to the climatology of years 200–400, excluding the first 200-y adjustment phase to the initial conditions. (B) Century-averaged SAT anomaly in degrees Celsius over the North Atlantic for years 450–550 (the peak of the cold event) relative to the climatology of years 200–400.
