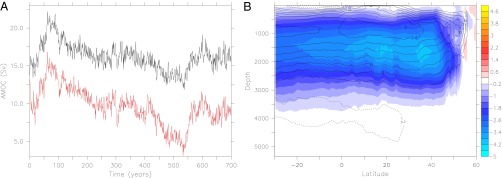
Fig. 2.

The AMOC during the first 700 y of the preindustrial run. (A) Time series of the AMOC in sverdrups (Sv = 106 m3 s−1). The maximum overturning is in black, and the overturning strength farther north (36°N) and deeper down (1,600 m) is in red and featured the maximum response during the cold event. (B) Century-averaged AMOC anomaly for the years 450–550 relative to the climatology of years 200–400 in color scale. The AMOC climatology of years 200–400 is contoured. Both features are displayed as a function of latitude between 30°S and 60°N, and of depth.
